


Description
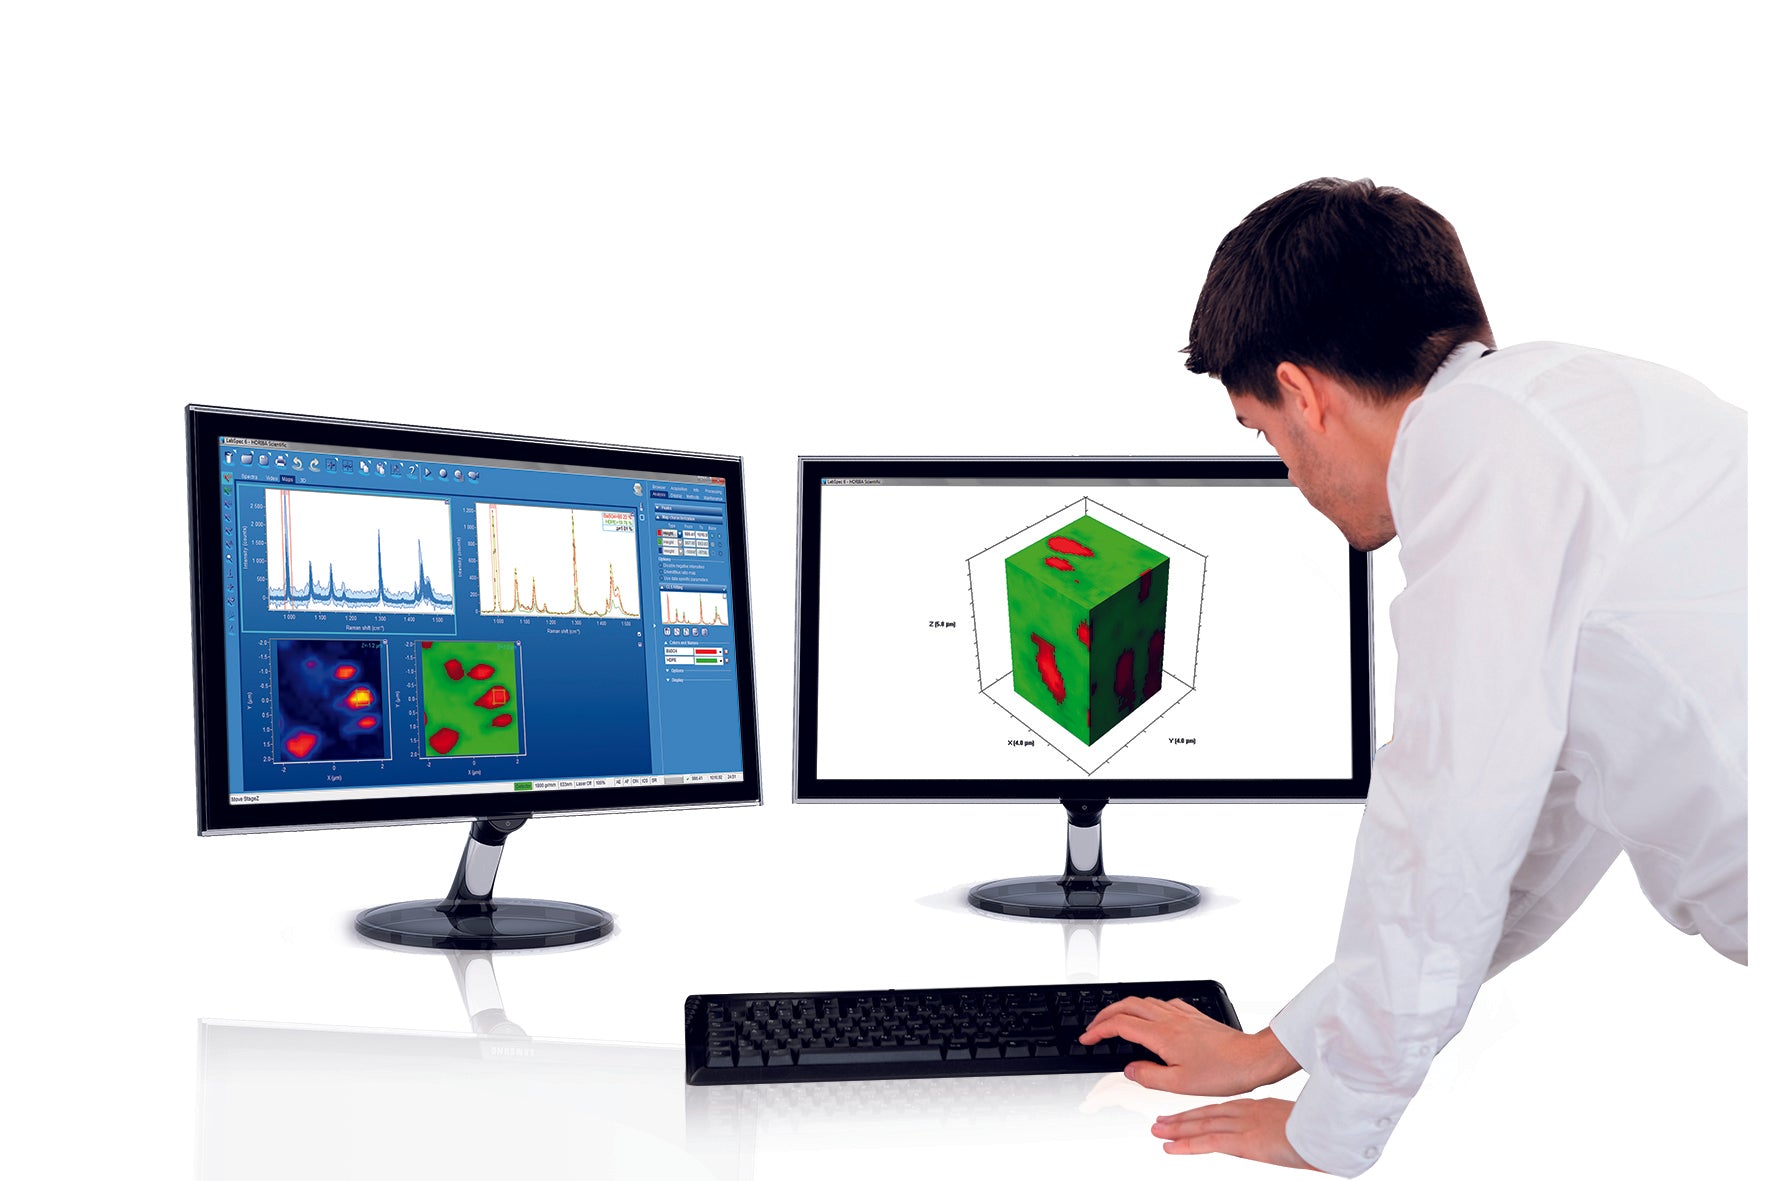
MVAPlus software: The multivariate analysis module for all Raman maps
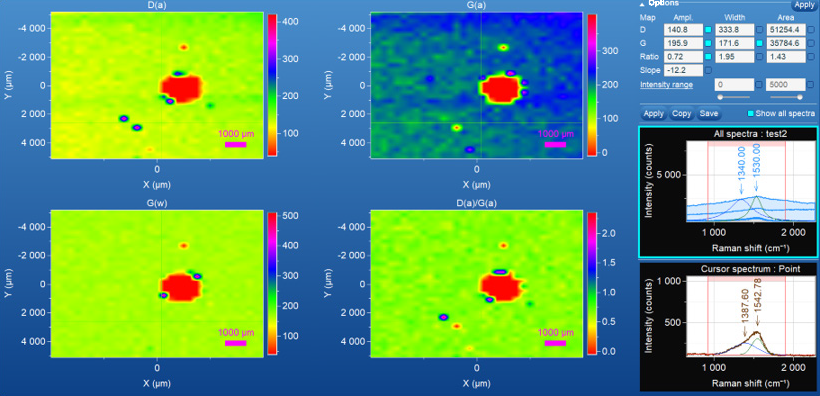
With MVAPlus, complex Raman chemical images can be processed and characterized rapidly and easily.
Compatibility:
This app requires the latest version of LabSpec6. If you do not already own LabSpec6, please go to the LabSpec6 product page to purchase your LabSpec6 license.
If you already own LabSpec6, you will be contacted by our service team for a free upgrade to the latest available version, if needed.
Conditions of use:
- App usable on a PC.
- Can be transferred to another PC via HFR.
- Permanent license.
- Free updates in LabSpec6.
Details
With MVAPlus, complex Raman chemical images can be processed and characterized rapidly and easily. A totally integrated module within the LabSpec6 software suite, MVAPlus has been tested and validated on a variety of datasets from small to large and with various Signal-to-Noise ratios.
Thus the MVAPlus app:
• Combines all the most common unsupervised multivariate algorithms (PCA, MCR, HCA and K-means) for loading generation with Smart Adaptative Classical Least Squares (CLS) Fitting for image generation.
• Automatically determines the reference spectra of your spectral dataset faster than ever.
• Compares, in the blink of an eye different multivariate algorithms.
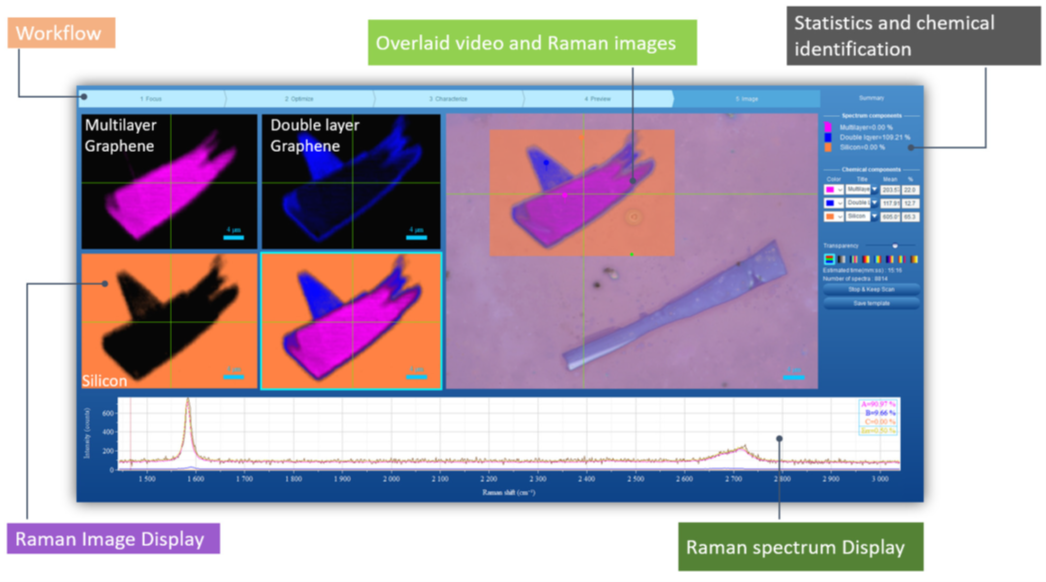
• Provides a user-workflow-based interface for Raman image generation.
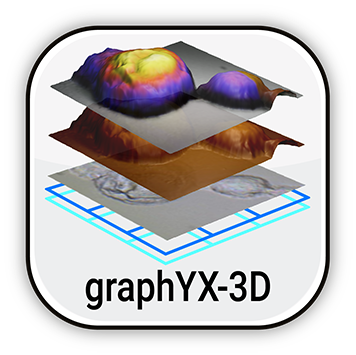
MVA for large and 3D samples
MVAPlus enables multivariate analysis on huge datasets up to 4,000,000 points including 3D maps.
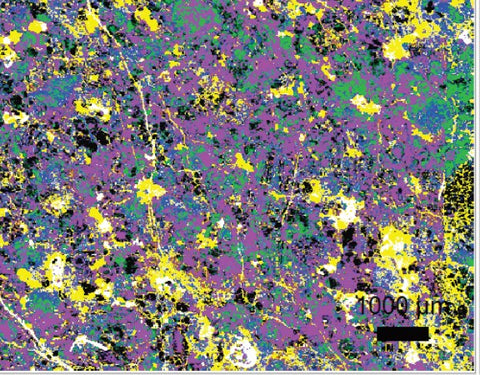
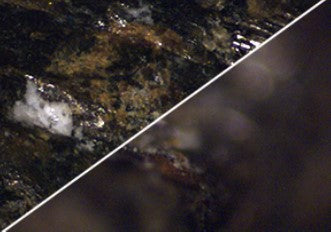
Meteorite picture (726, 656 points)
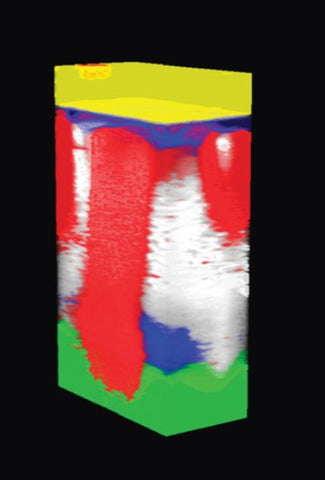
3D multilayer polymer (230x120x400 μm 1,490,400 points)
Data Processing has never been so easy
An algorithm comparator tool is included in MVAPlus. This tool compares loadings obtained with different algorithms, allowing the most appropriate method for the analyzed dataset to be found.
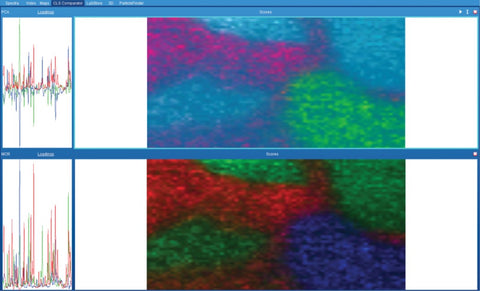
Comparison between PCA and MCR applied on a pharmaceutical tablet mapping
Simple user interface
The MVAPlus user interface follows the natural MVA workflow, i.e. method selection, loading calculation, and finally, image generation. It automatically adjusts the image processing according to the selected method. Loadings identification is simplified with auto-identification by KnowItAll® software. Moreover, it allows the generation of additional data such as error maps, residual spectra, scatter graphs, etc.
Main Applications
Pharmaceutical
• API identification and quantification
• Contaminant identification and quantification
• Counterfeit detection and origin
Lifescience technology and clinics
• Cell line identification (medical diagnostic and research)
• Proteins distribution in specific cell/tissue
• Bacteria/virus protein identification and quantification
Geology/environment
•Mineral sample composition and identification
• Contaminants in soil/water identification or quantification
Forensic/food safety
• Identification of food product origin (oil…)
• Accurate analysis of trace evidence
Polymers
• Multilayer film analysis
• Blending study
Energy
• Cathode molecular conversion
• Solar cell defect analysis
Archaeometry
• Fossil and artifact composition
• Artefacts manufacturing investigations
Downloadable application only
If you want more information about this topic, please visit our website on What is Raman Spectroscopy? - HORIBA
You may also like